컨셉
그래프 출력 시 한 페이지에 그래프를 삽입하는 방법은 여러가지가 있을 수 있는데,
그 중 한가지 방법에 대해 알아보자.
1. 먼저 그래프를 출력 후 이미지로 저장하고
2. 그 이미지를 다시 불러와서
3. RTF 출력하는 방식
이전 포스팅을 먼저 보고 오려면 아래 링크 Click
2022.05.04 - [끄적이는 통계분석/SAS] - SAS로 RTF 파일 출력하기 1
SAS로 RTF 파일 출력하기 1
기본 형태 ods listing close; options nodate nonumber orientation=portrait; ods rtf file="출력파일경로\출력파일명.RTF"; procedure or ods text ... ods rtf close; ods listing; 기본 형태의 틀에 하나..
youivab.tistory.com
2022.05.06 - [끄적이는 통계분석/SAS] - SAS로 RTF 파일 출력하기 2
SAS로 RTF 파일 출력하기 2
이전 포스팅을 먼저 보고 오려면 아래 링크 Click 2022.05.04 - [끄적이는 통계분석/SAS] - SAS로 RTF 파일 출력하기 1 4. TOC (Table of Contents) 생성 여러 방법이 있지만, 원하는 부분에 직접 TC를..
youivab.tistory.com
2022.08.09 - [끄적이는 통계분석/SAS] - SAS로 RTF 파일 출력하기 3 (proc report)
1. 이미지 저장하기
| ods listing gpath="C:\"; ods graphics / reset=all imagename="Figure" outputfmt=jpeg height=4in width=4in; proc sgplot data=sashelp.class; scatter x=height y=weight; ellipse x=height y=weight; run; |
- gpath: 이미지 파일 저장 위치 지정
- reset=all: 코드 실행 시마다 파일이 1부터 생성
- outputfmt: 파일형식 지정
- height, width: 높이, 너비 지정
2. 이미지 위치 데이터셋 생성
| data f1; length c1 $200.; c1='^S={width=4.0in just=center preimage="C:\Figure1.jpeg"}'; output; run; |
 |
- 원하는 스타일 지정
3. ODS RTF 출력
| ods listing close; options nodate nonumber orientation=portrait; ods escapechar = "^"; ods rtf file="C:\test.RTF" STYLE=custom; proc report data=f1; columns C1; define C1 / display ' '; compute after _page_; line ""; endcomp; run; ods rtf close; ods listing; |
 |
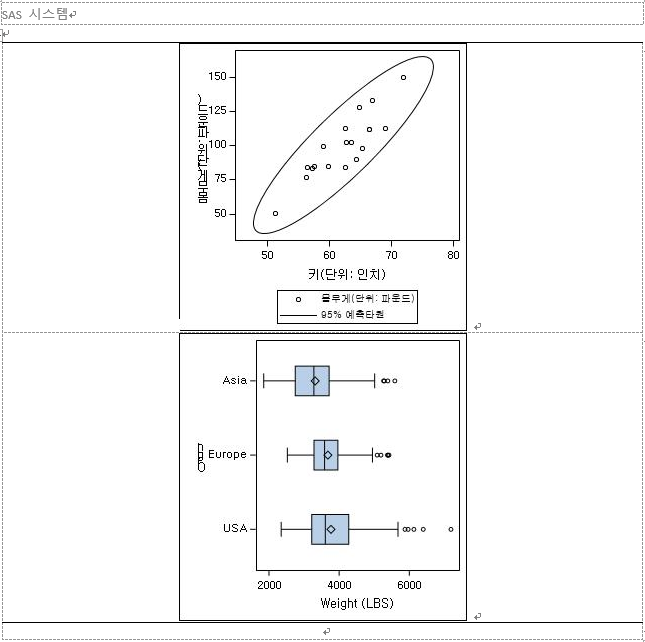
4. 두개의 그래프를 한페이지에 출력하고 싶다면 (2행 1열)
| ods listing gpath="C:\"; ods graphics / reset=all imagename="Figure" outputfmt=jpeg height=3in width=3in; proc sgplot data=sashelp.class; scatter x=height y=weight; ellipse x=height y=weight; run; proc sgplot data=sashelp.cars; hbox weight / category=origin; run; data f1; length c1 c2 $200.; c1='^S={width=3.0in just=center preimage="C:\Figure1.jpeg"}'; c2='^S={width=3.0in just=center preimage="C:\Figure3.jpeg"}'; output; run; ods listing close; options nodate nonumber orientation=portrait; *landscape; ods escapechar = "^"; ods rtf file="C:\test.RTF" STYLE=custom; proc report data=f1; columns C1 C2; define C1 / display ' '; define C2 / display ' '; compute after _page_; line ""; endcomp; run; ods rtf close; ods listing; |
 |
5. 두개의 그래프를 한페이지에 출력하고 싶다면 (1행 2열)
| ods listing gpath="C:\"; ods graphics / reset=all imagename="Figure" outputfmt=jpeg height=3in width=3in; proc sgplot data=sashelp.class; scatter x=height y=weight; ellipse x=height y=weight; run; proc sgplot data=sashelp.cars; hbox weight / category=origin; run; data f1; length c1 $200.; c1='^S={width=3.0in just=center preimage="C:\Figure1.jpeg"}'; output; c1='^S={width=3.0in just=center preimage="C:\Figure3.jpeg"}'; output; run; ods listing close; options nodate nonumber orientation=portrait; *landscape; ods escapechar = "^"; ods rtf file="C:\test.RTF" STYLE=custom; proc report data=f1; columns C1; define C1 / display ' '; compute after _page_; line ""; endcomp; run; ods rtf close; ods listing; |
 |
'끄적이는 프로그래밍 > SAS 프로그래밍' 카테고리의 다른 글
| SAS programming 기초 (Dataset 만들기, 외부데이터 불러오기, proc import, infile 문) (2) | 2022.08.27 |
|---|---|
| Mock-up shells(TFLs) 와 통계분석 결과 결합하기 (SAR) (0) | 2022.08.16 |
| SAS로 RTF 파일 출력하기 3 (proc report) (2) | 2022.08.09 |
| SAS로 RTF 파일 출력하기 2 (2) | 2022.05.06 |
| SAS로 RTF 파일 출력하기 1 (1) | 2022.05.04 |